Cost-to-Ship: a proposed BuilderProof axis for pricing you cannot compare line-by-line (July 2026)
As of July 2026 the five builders in our cohort bill in five incompatible units. We propose a sixth BuilderProof axis, Cost-to-Ship, that fixes the workload and measures real dollars to a deployed app. Open for review until August 3, 2026.
On this page
Abstract. Every BuilderProof axis so far assumes we can line vendors up on one scale: milliseconds for speed, Lighthouse points for deploy quality, a 0 to 100 sub-score for code portability. Pricing breaks that assumption. As of July 2026 the five builders in our standard cohort bill in five units that do not convert into each other: complexity-weighted credits, monthly token allotments, dollar-denominated effort credits, seat licenses with token overage, and a split message-plus-integration credit ledger. A "$25 plan" means a different amount of shipped software on each one. This note proposes a sixth axis, Cost-to-Ship, that measures the real dollars it takes to reach a working, deployed app against a fixed reference workload, plus how transparent and predictable that spend is. It is open for community review until August 3, 2026.
Quick answer (July 2026)
You cannot rank AI app builder pricing by comparing monthly sticker prices, because no two vendors in our cohort bill in the same unit. BuilderProof's proposed Cost-to-Ship axis normalizes spend by fixing the work (one reference app, built to first successful deploy plus one iteration cycle) and measuring the dollars each builder consumes to get there, scored alongside two hygiene sub-scores: unit transparency and cost predictability. Provisional unit findings are below; provisional dollar scores are deliberately not yet published, because the reference workload spec is still open for review.
The problem: five vendors, five incompatible units
We pulled each vendor's own published pricing on July 10, 2026. Here is what a paying customer is actually charged against, in the vendor's own terminology.
Scroll to see more
| Builder | Primary billing unit (vendor's own term) | What one unit buys |
|---|---|---|
 Lovable Lovable | Credits, consumed per message, "credits vary based on task complexity" | A prompt costs roughly 0.5 to 1.7 credits depending on complexity; plans priced by credits included, "not by seats" |
 Bolt Bolt | Tokens, on a monthly subscription allotment | Pro starts at 10M tokens/month with rollover; Teams bills per member and tokens "are not shared among team members" |
 Replit Replit | Dollar-denominated monthly credits, effort-based / pay-as-you-go | Core includes "$25 of monthly credits", Pro includes "$100 monthly credits"; agents consume credits by usage intensity |
 v0 by Vercel v0 by Vercel | Included credits per seat, with per-token overage | Team is $30/user/month with "$30 of included monthly credits per user"; overage metered per input/output/cache token by model |
 Base44 Base44 | Two separate credit ledgers: message credits and integration credits | Builder ($40/mo) grants 250 message credits and 10,000 integration credits; free tier grants 25 and 100 |
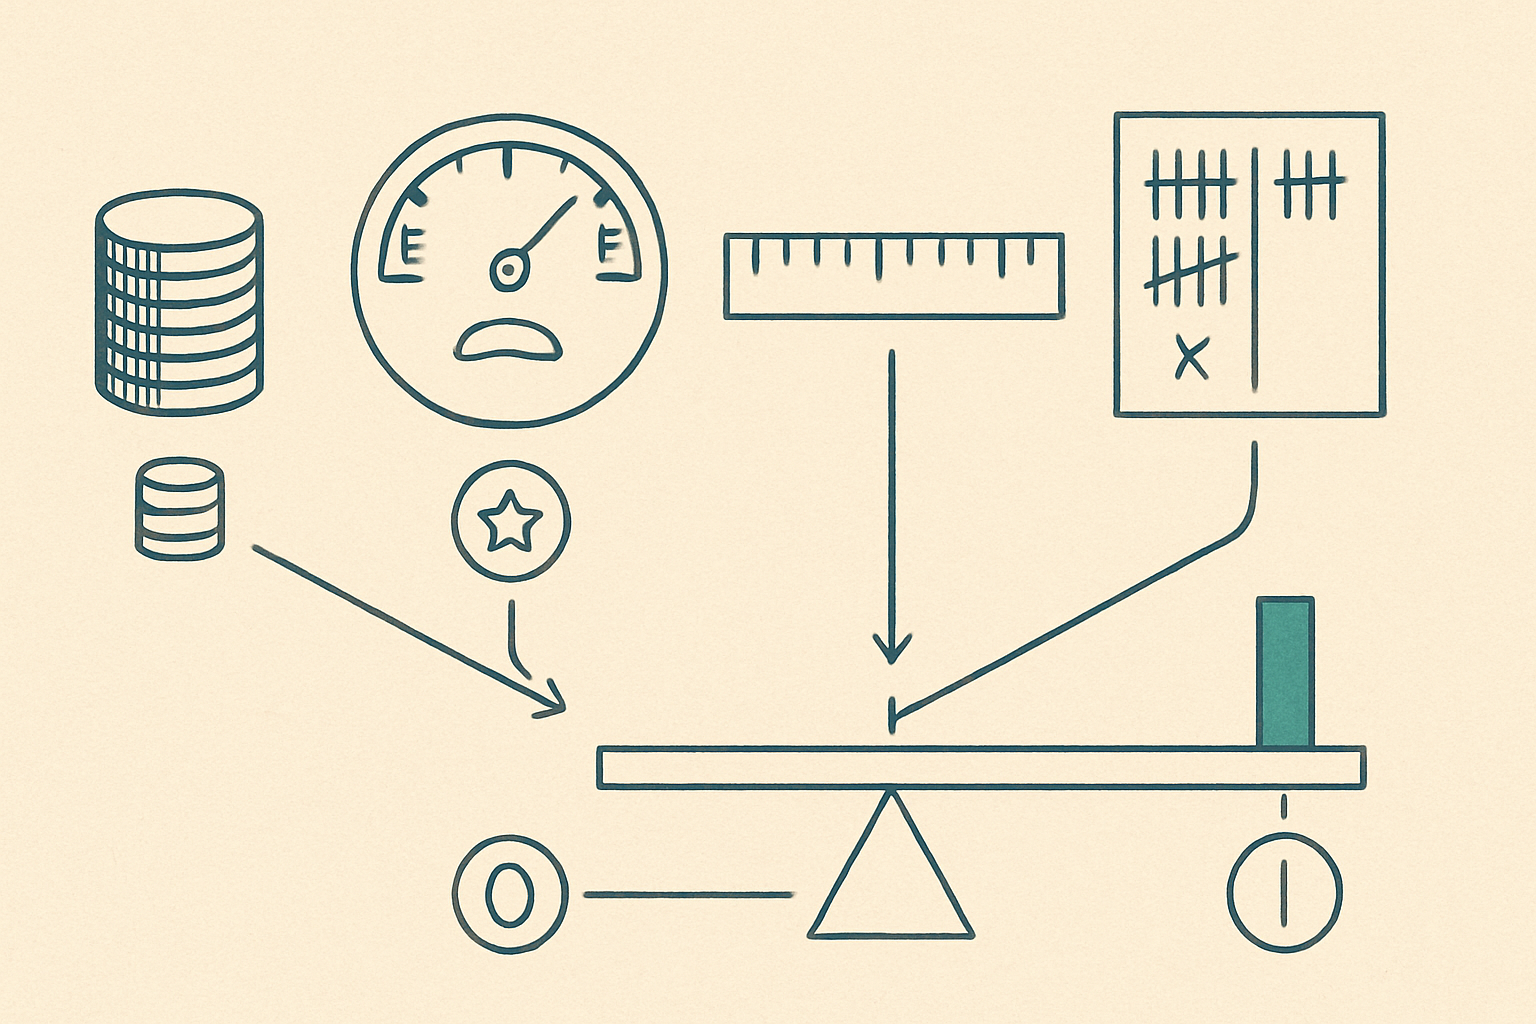
Five rows, five units. A Lovable credit is a fraction of one prompt. A Bolt token is a fraction of one word. A Replit credit is literally one US dollar of metered work. A v0 credit is a dollar too, but sits behind a per-seat gate and then meters tokens on top. A Base44 message credit is one whole AI turn, tracked separately from the integration actions that same turn might trigger. There is no exchange rate between these. Any table that puts "$25", "$25", "$20", "$30", "$40" in a column and implies a ranking is comparing labels, not value.
Why the monthly sticker price lies
Three structural reasons the headline number is not the number that matters:
- Complexity weighting hides the real rate. Lovable states outright that credit cost per message "varies based on task complexity." A cohort of simple prompts and a cohort of hard prompts produce different effective prices on the same plan. The sticker price bounds nothing.
- Token allotments convert to output non-linearly. Bolt's 10M monthly tokens on Pro is a large number until you learn that a single non-trivial iteration on a growing codebase can spend tokens re-reading context. Tokens per shipped feature, not tokens per month, is the quantity that decides your bill.
- Seat gates and dual ledgers change what "one plan" even includes. v0 charges per user before any building happens, then meters tokens as overage; Base44 can exhaust integration credits while message credits remain (or the reverse), stalling a build for a reason the plan price never signaled.
None of this is a criticism of any vendor's pricing. Metered, usage-based billing is a defensible model. The point is narrower and it is a measurement point: the published price is not a comparable quantity across the cohort, so an honest benchmark has to manufacture comparability by fixing the workload instead.
The proposed axis: Cost-to-Ship
Cost-to-Ship scores the answer to a buyer's actual question: for a defined piece of software, what will this builder cost me to get it live, and how confidently can I predict that before I start?
Composite: 0 to 100, weighted mean of three sub-scores.
Sub-score 1: Reference-workload dollar cost (60%). We fix the work, not the plan. The reference workload is BuilderProof's standard benchmark app (a small authenticated CRUD app with one third-party integration and one deploy) taken to first successful deploy plus one realistic iteration cycle. We run it on each builder, on the cheapest plan that can complete it, and record the actual dollars spent including any overage. Output: dollars per reference-app. Lower is better; the score is a normalized rank inside the cohort, refreshed each quarter.
Sub-score 2: Unit transparency (25%). Can a buyer predict the bill before building? Graded on whether the vendor publishes (a) the billing unit, (b) the consumption rate of that unit for a typical action, and (c) overage behavior. Lovable disclosing "1 credit per message" in Plan Mode and Replit denominating credits in dollars score well here; opaque "varies by complexity" language without a worked example scores lower. This sub-score rewards documentation, not low prices.
Sub-score 3: Cost predictability (15%). The variance of the bill for the same work run three times. A builder whose effective cost swings widely across identical runs is harder to budget than one that lands in a tight band, even at a higher mean. Measured as coefficient of variation across repeated reference-workload runs.
Provisional observations (no scores yet, on purpose)
We are publishing the units now and withholding the dollar scores until the reference-workload spec is locked, because a half-specified workload would produce numbers that look authoritative and are not. That said, three neutral observations already hold from the vendor documentation alone:
- Dollar-denominated credits (Replit) are the most directly legible for a buyer estimating spend, because the unit is already in the currency the invoice arrives in. That is a transparency property, not a value judgment on total cost.
- Token allotments (Bolt) reward efficient, context-light iteration and penalize workflows that repeatedly regenerate large surfaces. Whether that helps or hurts you depends on your app's shape.
- Dual-ledger models (Base44) can stall on the axis you were not watching. Buyers should read both the message-credit and integration-credit columns before choosing a plan, not just the price.
We are not ranking these today. We are saying the comparison requires a fixed workload, and here is the method we propose to fix it.
What we are explicitly not doing
- Not scoring "value for money" as a vibe. Cost-to-Ship is dollars against a fixed spec, full stop. Whether those dollars are "worth it" is the reader's call once output quality (a separate axis) is in front of them.
- Not comparing free tiers as if they were products. Free-tier ceilings (Lovable's daily 5 build credits, Bolt's 300K tokens/day, v0's 7 messages/day) are noted for context but do not enter the composite, because no serious app ships inside them.
- Not folding in hosting or domain costs yet. Those belong to the deploy-quality axis and would double-count here.
How to contribute
BuilderProof scores are community-editable by design. Two things would move this proposal forward before the August 3, 2026 review closes:
- Challenge the reference-workload spec. If the standard benchmark app is unrepresentative of how your team actually builds, tell us where. The workload is the entire ballgame; get it wrong and every dollar figure downstream is wrong.
- Contribute a reproducible run. If you have receipts (literal ones) for building a comparable app on any cohort builder, a documented run with the plan, the prompts, and the final invoice is worth more than any estimate we can model.
This proposal sits alongside our existing BuilderProof benchmarking methodology and follows the same review process we used for the code-portability axis proposed in June 2026. Cost and portability are the two lock-in questions buyers ask most, and neither is answerable from a pricing page alone.
Sources (accessed July 10, 2026)
- Lovable pricing, lovable.dev/pricing (2026): credits, "credits vary based on task complexity", "priced by the credits they include, not by seats".
- Bolt pricing, bolt.new/pricing (2026): monthly token allotments, Pro "start at 10M tokens per month", token rollover for paid subscribers.
- Replit pricing, replit.com/pricing (2026): effort-based / pay-as-you-go, Core "$25 of monthly credits", Pro "$100 monthly credits".
- v0 by Vercel pricing, v0.app/pricing (2026): "$30 of included monthly credits per user", per-token overage by model.
- Base44 pricing, base44.com/pricing (2026): separate message credits and integration credits, Builder plan 250 / 10,000.
Written by
BuilderProof editorial teamCite this benchmark
BuilderProof editorial team. "Cost-to-Ship: a proposed BuilderProof axis for pricing you cannot compare line-by-line (July 2026)". BuilderProof, July 2026. https://www.builderproof.org/benchmarks/cost-to-ship-axis-proposal-july-2026.
@misc{builderproof-cost-to-ship-axis-proposal-july-2026,
  title  = {{Cost-to-Ship: a proposed BuilderProof axis for pricing you cannot compare line-by-line (July 2026)}},
  author = {{BuilderProof editorial team}},
  year   = {2026},
  month  = {jul},
  howpublished = {\url{https://www.builderproof.org/benchmarks/cost-to-ship-axis-proposal-july-2026}},
  note   = {BuilderProof, builderproof.org}
}
Frequently asked questions
Why can't you just compare the monthly prices of AI app builders?
Because as of July 2026 the cohort bills in five different units: Lovable in complexity-weighted credits, Bolt in monthly token allotments, Replit in dollar-denominated effort credits, v0 in per-seat included credits plus token overage, and Base44 in separate message and integration credit ledgers. A $25 plan buys a different amount of shipped software on each, so the sticker prices are labels, not a comparable quantity.
What is the Cost-to-Ship axis measuring?
The real dollars each builder consumes to take a fixed reference app to first successful deploy plus one iteration cycle, weighted 60%, combined with a unit-transparency sub-score (25%) and a cost-predictability sub-score (15%). It fixes the work and measures the spend, rather than comparing plan prices.
When will BuilderProof publish Cost-to-Ship scores?
Not until the reference-workload spec is locked. The proposal is open for community review until August 3, 2026. Publishing dollar scores against a half-specified workload would look authoritative without being reproducible, which violates the methodology.
Related benchmarks

How We Benchmark AI App Builders: The BuilderProof Methodology v1
BuilderProof methodology v1.1: the published rubric, brief OQ-7, environment standards and weights used to score AI app builders on output quality, speed, deploy quality and agency suitability. The four June 2026 result sets were withdrawn on August 21, 2026 as placeholder data, so the lab currently publishes method, not scores.
Code-portability: a v2 axis proposal (June 2026)
We are proposing a fifth BuilderProof axis to score whether an AI app builder ships code that can leave the platform. Five sub-axes, 0 to 100, provisional cohort scores included.

Does the invoice total actually add up? A proposed axis for money arithmetic in AI-generated apps (September 2026)
A proposed BuilderProof axis measuring whether the applications AI app builders generate store and compute money exactly, or only render it that way. Seven weighted signals, four postures, a ten-step protocol with a control step. Pre-registered: no builder is scored here.