Can Ten People Use It at Once? A Proposed Axis for Database Connection and Query Cost (September 2026)
One user cannot exercise a shared connection pool. We propose an axis for whether a generated app survives ten people at once, and find the unbounded wait is the default at three separate layers.
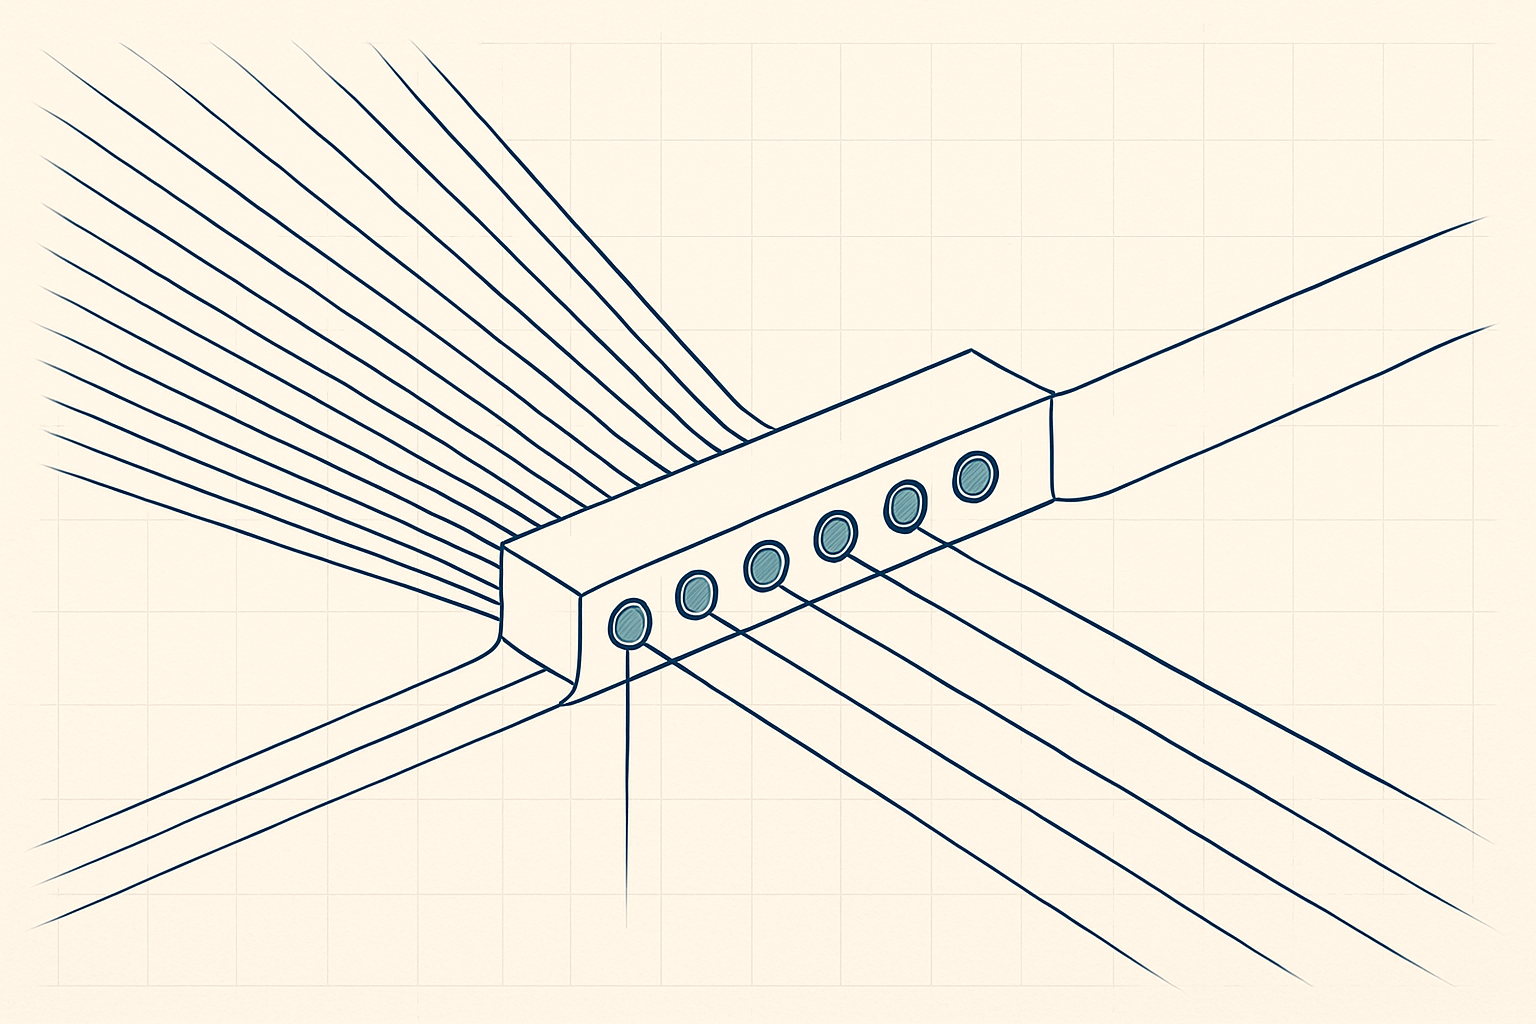
On this page
Every application an AI app builder generates is used by exactly one person on the day it is generated, and that person is the developer. One browser tab, one request at a time, one connection to the database. The property this axis proposes to measure does not exist under that condition and cannot be observed there, because it is a property of contention and there is nothing to contend with. It arrives on the first day the application has ten people in it at once. We are not scoring anyone today. We are publishing a candidate axis, its rubric, its posture levels and a reproduction protocol, and opening all of it for comment.
Quick Answer
Database connection and query cost is a proposed BuilderProof benchmark axis, drafted September 12, 2026, that scores whether a generated application can still serve requests when several people use it simultaneously, and whether the resources it holds while doing so are bounded by something somebody chose. It is a capacity question about a shared fixed resource, not a correctness question about a result set, and that is what separates it from the axis we proposed on September 2. The failure it targets announces itself as a refusal rather than a wrong answer: the request is not served at all. Seven signals, weighted, scored from the emitted project plus a concurrency probe against a deployed build. This page is an axis proposal open for community edits, not a leaderboard.
Why we are proposing this axis
A database connection is not a message. It is a session, and it is held.
The clearest statement of this we found is in 
A ten millisecond query holding a slot for seconds is a ratio of several hundred to one between the work and the resource. That ratio is invisible with one user, because one slot is enough for any ratio. It is the whole problem with a hundred.
The number of slots is small and it is fixed. The 
max_connections a default that is "typically 100 connections, but might be less if your kernel settings will not support it", states flatly that "at most max_connections connections can ever be active simultaneously", and then closes the obvious escape route: "This parameter can only be set at server start." Three of those slots are not yours either, since superuser_reserved_connections defaults to three and is held back as a reserve. On a managed platform the shortfall is larger than that, because Supabase's own limits page notes that its services "hold their own connections, including Auth, Storage, PostgREST, and the health checker, and those come out of the same total."
So the budget is roughly a hundred, it cannot be raised without restarting the server, and some of it is spent before the generated application opens its first connection. None of that is a criticism of any builder. It is the shape of the resource every generated application is standing on, and it is the reason a property that looks like a performance concern is really a correctness concern about a limit.
The unbounded wait is the default in three separate places
This is the part of the research that changed our view of the axis, and it is why we think the page is worth writing rather than filing as a backlog item.
We expected to find that generated applications choose badly. What we found is that at three independent layers, the bounded behaviour is the thing you have to ask for, and the unbounded behaviour is what arrives when nobody chooses. Nobody picked it. It is the default.
First, at the database. Four separate PostgreSQL parameters exist to stop one client holding a slot forever, and all four ship disabled. statement_timeout: "A value of zero (the default) disables the timeout." transaction_timeout: "A value of zero (the default) disables the timeout." idle_in_transaction_session_timeout: "A value of zero (the default) disables the timeout", on a parameter whose own documentation explains that it "can be used to ensure that idle sessions do not hold locks for an unreasonable amount of time." lock_timeout: "A value of zero (the default) disables the timeout." Four instruments for bounding how long a connection may be occupied, four defaults of zero.
Second, at the client library. 
pool_timeout at 10 seconds in v6 and is connectionTimeoutMillis at "0 (no timeout)" in v7. Connection timeout was connect_timeout at 5 seconds in v6 and is "0 (no timeout)" in v7. Connection lifetime was already "0 (no timeout)" and remains so. Two of those defaults moved from bounded to unbounded across a major version, which Prisma itself makes legible by publishing a snippet titled "Matching Prisma ORM v6 defaults with the pg driver adapter" for anyone who wants the old behaviour back.
We want to be careful here, because this is a documentation reading and not a verdict about a library. Prisma moved pooling to the driver deliberately and documents the change and its remedy in the same place, which is more than most layers do. The observation that matters for this axis is narrower: an application generated against v7 defaults waits forever to acquire a connection unless the generation set a timeout, and the generation had no reason to.
Third, at the pool size. The default is not chosen against the database at all, it is chosen against the machine the code lands on. Prisma's v6 default pool size was num_cpus::get_physical() * 2 + 1, a formula over the host's CPU count, and its v7 pg adapter default is a flat max of 10. Supabase's own guidance is blunt about what that means in a serverless runtime: "Library defaults are too high for serverless. Postgres.js defaults to 10 connections. That is 10 connections for every warm instance of your function, and the number of warm instances isn't something you control. A few dozen instances is enough to exhaust the pool."
Read those three together. A fixed ceiling of about a hundred slots that cannot be changed at runtime, no default limit at either end on how long a slot may be held, and a default pool size derived from the size of the machine rather than the capacity of the database. That is the configuration a generated application inherits before anyone writes a line of it.
This is the third time this series has landed on the same shape. Byte equality was the default in the text-comparison proposal and an unbounded session was the default in the session-lifetime proposal. In all three cases the defect is not a bad decision, it is an absent one, which is exactly why a rubric has to score whether a decision was made rather than which decision it was.
The remedy for this axis disables the remedy for two others
The standard fix for connection exhaustion is a server-side pooler, and we need to be honest that it is not free, because it takes away capabilities that two of our own published axes reward.

The compatibility table itself is the document to read, because the word in the transaction-pooling column for a long list of features is not "limited" or "degraded". It is "Never". SET and RESET: Never. LISTEN: Never. PREPARE and DEALLOCATE: Never. WITH HOLD CURSOR: Never. PRESERVE and DELETE ROWS temp tables: Never. LOAD statement: Never. Session-level advisory locks: Never.
Supabase says the same thing about its own shared pooler in plainer prose, and its list is worth reading against our rubrics: "Session-level state is lost between transactions. This covers set and reset, session-level advisory locks, listen and notify, and temporary tables."
Two entries in that list are remedies we ourselves weight.
Our background-work correctness proposal scores overlap control at weight 14, and the remedies it names are "a lock, a row claim such as SKIP LOCKED, or an enforced duration ceiling". A session-level advisory lock is the first of those, and it does not survive a connection returning to the pool. So an application that adopts transaction pooling to score well here loses one of the three mechanisms that scores well there. Note which one survives: a row claim held inside a single transaction is unaffected, because it lives in the transaction rather than in the session. The remedy is available, it is just narrower than it was, and a generated application has no way of knowing which of the two it picked matters.
Our realtime subscription correctness proposal rests on the database notification layer, and LISTEN is in the same list. NOTIFY is permitted in transaction pooling and LISTEN is not, which produces the sharpest single line in PgBouncer's table: an application behind a transaction pooler can still send a notification it can never receive.
We are not claiming these axes are incoherent together. We are claiming they are in tension, that the tension is documented by the vendors rather than inferred by us, and that a rubric which scored each axis as if the others did not exist would be rewarding a configuration that cannot exist. The resolution in both cases is SCOPE rather than choice: put the state inside the transaction that needs it, or use session mode for the component that genuinely needs a session, and say which you did.
The same port number reaches two different poolers
Here is a fact we did not expect and have not seen written down, and it falls out of reading two vendors' documentation against each other rather than reading either more carefully.
Supabase runs two poolers. Its limits page says so directly: "The shared pooler, Supavisor, is multi-tenant, available on every project, and IPv4-only. The dedicated pooler, PgBouncer, is available on paid plans and runs alongside your Postgres instance." Its connection page then explains the routing: "Port 5432 reaches Postgres for a direct connection and Supavisor for session mode. Port 6543 reaches PgBouncer for the dedicated pooler and Supavisor for shared transaction mode."
So port 6543 is transaction mode, and which pooler answers on it depends on your plan.
Now put the two products' documentation side by side on one capability. Supabase's transaction-mode caution is unambiguous: "Transaction mode does not support prepared statements. To avoid errors, turn them off in your connection library", with a table of the flag each driver needs, prepare: false for Postgres.js and Drizzle, pgbouncer=true for Prisma, statement_cache_size=0 for asyncpg, prepareThreshold=0 for JDBC. PgBouncer's own compatibility table says protocol-level prepared plans work in transaction pooling, with a footnote that "you need to change max_prepared_statements to a non-zero value to enable this support", and its configuration reference gives that setting a default of 200, which is not zero. PgBouncer explains the mechanism too: it rewrites the client's statement name to an internal one and "if the prepared statement that the client wants to execute is not yet prepared on the server ... transparently prepares the statement before executing it."
Neither document is wrong. They are describing two different poolers, and each is accurate about its own. The consequence neither states is the one an operator cares about: whether prepared statements work in "transaction mode" on this platform is a property of which pooler answered, therefore of the billing plan, and the two connection strings differ only in host.
This also corrects something we had believed and would have written. The widely repeated claim that transaction pooling does not support prepared statements is true of the shared pooler as documented, and it is not a general property of transaction pooling, because PgBouncer documents the opposite for protocol-level statements and ships it on by default. SQL-level PREPARE and DEALLOCATE remain "Never" in both. That distinction matters for a rubric, because scoring an application for turning prepared statements off would penalise a correct configuration on one pooler and reward a lossy one on the other.
It is also the second time in three proposals that a capability turned out to be gated on a plan rather than on the code, which is starting to look like a structural property of generated applications on managed platforms rather than a coincidence.
What this axis measures, and what it does not
Four boundaries keep the axis from swallowing its neighbours.
- It measures capacity under simultaneity, not the cost of one traversal. Many clients and one shared pool, where the question is whether the request is served at all.
- It measures reads and writes alike, because the resource does not care. A connection held by a slow report and a connection held by a slow insert are the same slot.
- It measures the untouched default. Read from the emitted project of a reference build, before anyone tunes a pool size or adds a timeout.
- It is not a preference for poolers. A persistent server with a modest application-side pool needs no server-side pooler at all, and Supabase says as much: "On a persistent backend, such as a long-running container or VM, an application-side pooler is enough on its own." The axis asks whether the connection strategy matches the runtime the code was deployed to, not whether it picked the component we like.
What this axis explicitly does not measure: whether the list returns every row once, whether two overlapping writes both survive, whether the query is authorized, or whether a slow page is rendered with a loading state. Those are separate axes we already publish or already propose.
The proposed rubric
Seven signals, weighted, scored from the emitted project and a concurrency probe against a deployed build. Weights are a proposal and are the part we most want argued with. The third column describes what a failing case looks like, because a failing case is easier to check than a definition.
Scroll to see more
| Signal | Weight | What a failing case looks like |
|---|---|---|
| Pool size chosen against the database, not the machine | 22 | The application-side pool is the library default, or a formula over the host's CPU count, with nothing in the project referring to the project's own connection limit. The ceiling becomes a property of whatever machine the code lands on, and a horizontally scaled runtime multiplies it by an instance count nobody controls |
| Time limits on holding a connection | 18 | No statement_timeout, no transaction_timeout and no idle_in_transaction_session_timeout anywhere in the emitted project or its migrations, so a single slow or stuck statement holds its slot until a client or a network gives up, and no acquire timeout on the client side either, so the queue behind it waits without bound |
| Pooling mode matches the session features the code uses | 16 | The application connects through transaction pooling and also uses LISTEN, a session-level advisory lock, a session-scoped SET, a with-hold cursor or a temporary table, so a feature the code depends on is documented as never working on the path it was deployed on |
| Connections are acquired per unit of work and released | 14 | A database client is constructed inside a request handler, a route module or a render function rather than once at module scope, so each invocation opens its own connection; or a connection is held across an await that does no database work |
| Exhaustion is surfaced as itself | 12 | A pool-acquire timeout, a pooler refusal and a database connection error all reach the user as the same generic failure, or as an empty list indistinguishable from "no rows". An operator cannot tell a capacity problem from a data problem, and neither can a tester |
| Query cost bounded by an index someone chose | 10 | The application's hot read has no supporting index, so the time each request holds its connection grows with the table. Cost and capacity are the same signal here, because a query that takes ten times as long occupies its slot ten times as long |
| Connection usage is observable | 8 | There is no first-party way to answer "how many connections are open and what are they doing", so the question can only be answered from a platform dashboard, if one exists, at whatever refresh interval it happens to have |
Three notes on the weights. Pool sizing carries the most because it is the only signal here whose failure scales with success: the more traffic the application gets, the more instances the runtime starts, and the more connections it opens, so the defect is worst exactly when the application is doing well. Time limits sit second because they are the difference between a slow request and an unavailable application, and because four separate database parameters exist for the purpose and all four default to off. Observability sits last not because it is unimportant but because it is the one signal whose absence a competent operator can work around from outside the application.
One signal on that table is not really about capacity, and it is easy to miss. Surfacing exhaustion as itself is a diagnosability property, and we weight it at 12 because it converts every other failure on this list from silent to reportable. An application that renders an empty list when its pool is exhausted has turned a capacity incident into what looks like a data problem, and the natural reading of an empty list is that nothing was entered.
The postures we can describe from documentation
We are deliberately not assigning builders to these postures. We have read platform and library documentation for this write-up and we are not going to characterise any vendor's generated output from documents about a library, still less rank anyone on it. What we can describe is the structural shape of the options, because the shape determines what the rubric can and cannot see.
Level 0, Unbounded. A database client is constructed per request. The pool is the library default. No timeout is set at either end, and nothing in the project refers to a connection limit. This is not exotic; it is what a correct-looking, working, demo-passing generation produces, because every condition that would distinguish it from a careful one is absent while it is being built.
Level 1, Pooled by accident. The client is created once at module scope, so the library's pool does real work and the application survives a warm instance serving many requests. The pool size is still the default and no time limit exists. This is where we expect a well-formed default build to land, and it is a real improvement, because it removes the per-request connection churn that makes Level 0 fail fastest.
Level 2, Sized. The pool size is a deliberate number, the connection path matches the runtime, and where a server-side pooler is in use the session features the code relies on have been checked against the mode. The application no longer exhausts its own budget under ordinary concurrency.
Level 3, Bounded. Level 2 plus limits on how long a connection may be held, enforced at the database rather than only in the client, plus exhaustion surfaced distinctly from other failures, plus a first-party way to observe connection usage. A capacity incident is survivable and, more importantly, diagnosable.
The 2 to 3 boundary is the one we expect to be argued with, because Level 3 asks for enforcement at the database and the generated application may not own the database configuration. We think that is the right place to draw it anyway, and the reason is in PostgreSQL's own documentation: a limit set in the client is a limit the client can decline to apply, while statement_timeout applies to the statement regardless of which client sent it.
How to reproduce it
The protocol requires a deploy and a concurrency probe. It costs more to run than a static read, and that cost is the reason this property is unmeasured rather than any subtlety in what it asks.
- Generate the reference application from the fixed prompt. The brief describes a small internal tool with a list view, a detail view and a create form, used by a team. It says nothing about concurrency, connections, pooling, timeouts or load. Asking for the safeguard would measure prompt compliance rather than default posture.
- Deploy it. Connection behaviour is a property of a real runtime. A local development server with one process and one user cannot exhibit any signal on this list.
- Run the single-client control first. Drive the application with one client, sequentially, and record latency and error rate. This is the baseline, and it must be clean before any result from step 6 means anything. A build that is already failing with one user is measuring a broken harness, not a capacity property.
- Read the emitted source for where the client is constructed. Module scope or request scope, and record the pool size together with where it came from: written during the generation, inherited from a library default, or absent entirely. Record it per entry point, because a route handler and a background task can differ inside one project.
- Read the published ceiling rather than guessing it. Query
max_connectionson the deployed database, note the configured pool size of any server-side pooler in the path, and note what the platform reserves for its own services. Supabase publishes the inequality this has to satisfy, direct connections plus each pooler's backend connections staying below the instance's maximum, and its own rule of thumb is to keep a pooler under 40 percent of available connections where other services share the database, or "cautiously" up to around 80 percent where they do not. - Raise simultaneous clients until something fails, and report the number. Not a pass or a fail: the count at which the first error appears, and the error text verbatim. The count is the reviewable evidence and the text is what makes step 7 possible.
- Classify the failure, because three different defects produce it. An acquire timeout inside the application's own pool, a refusal from a server-side pooler, which Supabase documents as the pooler ceasing to accept new client connections "until existing ones close", and a connection error from PostgreSQL itself once the slots are gone. The remedies differ completely and a rubric that records only "it broke" cannot distinguish them.
- Hold a slow statement and see whether anything ends it. Run one deliberately long statement and record whether it is terminated, by what, and after how long. Then read the three database timeouts directly. This step is what separates an application that recovers from one that needs a human.
- Exercise the session features the code actually uses against the mode it connects in. If the project uses LISTEN, a session-level advisory lock, a session-scoped SET or a with-hold cursor, and connects through transaction pooling, record it as a mode mismatch and say which feature. Do not infer this from the connection string alone, because on at least one platform the same port reaches two poolers with different capabilities.
- Run the documentation-versus-measurement control. Record what the platform documentation says the pooling mode supports, then record what the deployed application actually does. A generated application can be described accurately by its platform's documentation and still be configured in a way that mode does not support, and only the deployed build can tell you which.
Step 3 is the one most likely to be skipped and it is the one that makes the rest trustworthy. Step 6 without step 3 produces a number that cannot be attributed to anything.
The empty-waiting-room illusion
Our previous axes each named their characteristic trap. Tests that pass without asserting are the green-check illusion. A surface whose only consumer was written by the same run that wrote it is the sole-consumer illusion. An endpoint that only the honest caller ever reaches is the honest-caller illusion. The trap here is the empty-waiting-room illusion, and we borrow the room from Supabase's own explanation of pooling, which describes a client in transaction mode being sent back to "the figurative waiting room" after each query.
The illusion works like this. Every observation anyone makes of a generated application is made with an empty waiting room. There is one client, it is the developer, and it is the only thing in the queue. In that condition a pool of one and a pool of a thousand behave identically; a statement with no timeout and a statement with a two second timeout behave identically; a connection acquired per request and a connection acquired once behave identically; and an application that will refuse its eleventh simultaneous user is byte-for-byte indistinguishable in every trace anyone collects from one that will serve its thousandth. The operator concludes, reasonably, that the application works, because every signal available to them says so.
The illusion breaks in a way that is unusually hostile to diagnosis, for two reasons.
The first is that it breaks on success. Nothing about the application changed on the day it stopped working. What changed is that more people opened it, or that the platform started more instances of it because more people opened it, which multiplies the connection count by a number the developer does not control. The proximate cause of the outage is the traffic that made the project worth having.
The second is that the failure is a refusal rather than a wrong answer, and a refusal under load looks exactly like an outage with a different cause. The application returns errors to some users and not others, intermittently, with a shape that depends on which requests happened to arrive together. Nothing in the generated code is wrong on the line where it fails.
How this relates to our existing axes
We want to be explicit that this is not a duplicate of adjacent work, because it sits close to three axes we have already proposed, and the test we hold ourselves to before proposing anything is whether the two can move in opposite directions.
It is not our pagination and large-collection read correctness axis, and this is the closest boundary in the set because that axis carries a deep-page cost signal. That axis has one reader traversing one collection and asks whether every row comes back exactly once; its cost signal asks whether the price of page nine is bounded. This axis has many readers and asks whether a request is served at all. They move in opposite directions cleanly: a keyset-paginated list with a total order and a bounded page cost can still refuse the eleventh simultaneous reader, because the defect is the number of slots rather than the shape of the query, and an offset-paginated list that silently skips rows under mutation can be perfectly cheap and perfectly available.
The strongest support for that boundary is in that proposal's own limitations section rather than in anything we have added here. It states that deep-page cost "is not cleanly separable from general performance", and that "a slow page late in a collection may be the paging technique or may be an unindexed filter that would have been slow anywhere, and the rubric as written does not distinguish them." The general case it declines to separate is the case this axis is about. We would rather cite a neighbour conceding a gap than argue that the gap exists.
It is not our concurrent-write safety axis either, which is worth saying because both involve several clients at once and they share almost nothing else. That one has two writers and one row, and it asks whether both writes survive. This one has many clients and one shared fixed resource, and it asks whether the work happens at all. The failures are opposite in shape: a lost update is a wrong answer that looks right, while exhaustion is a refusal that looks like an outage. An application with a version predicate on every mutation and a unique constraint on every natural key can refuse its eleventh concurrent reader, and an application that serves a thousand simultaneous readers comfortably can still lose an update between two of them.
It is not our background-work correctness axis, whose overlap-control signal we discussed above. Overlap control there is one job overlapping itself, and its remedies are a lock, a row claim or a duration ceiling. Here it is unrelated clients competing for a pool none of them knows the size of. Opposite directions again: a scheduled job that can provably never run twice at once still occupies a connection slot for its whole duration, and a job with no overlap protection whatsoever occupies exactly one.
Finally, it is adjacent to but distinct from the question of what you can run the application on at all. Our practical explainer on self-hosting what a builder gives you covers the attached services a generated project depends on, and the database is one of them. That page asks whether you can stand the database up somewhere else. This one asks what the application does to the database once it is standing, and the two answers are independent: a project that self-hosts cleanly can exhaust its own connection budget on the first busy afternoon, and a project that is hopelessly tied to a managed platform can be a model citizen of that platform's connection limits.
What we are not claiming yet
No scores today. This page proposes the axis, the rubric, the signal weights, the postures and the protocol, and it ranks nobody. The postures above are structural descriptions rather than vendor assignments, and we have deliberately not characterised any builder's generated output on this axis, because we have not run the protocol and documentation about a library is not evidence about what a given generation does with it.
We are also not claiming that a server-side pooler is the right answer for every generated application. It is not, by the documentation's own account: a persistent backend with a small application-side pool needs no pooler in the path, and adding one buys a session-feature restriction in exchange for capacity it does not need. The rubric is written to score whether the strategy matches the runtime, and a scoring device that always preferred a pooler would be encoding a preference rather than measuring a property.
Limitations and open questions
- The concurrency level in step 6 is an unspecified parameter and it dominates the result. A probe at ten simultaneous clients and one at five hundred will produce very different answers from identical code, and we do not have a principled way to pick the number. Until we do, the figure is comparable only within one harness configuration. We currently favour reporting the count at which the first error appears rather than a score at a fixed level, which makes the number honest and makes cross-project comparison harder.
- Much of this may be a property of the platform rather than of the generation. Where the connection path, the pooler and the timeouts are all inherited, two builders sitting on the same platform will produce near-identical results that say little about either. The honest options are to score only the authored parts, to report inherited and authored sub-scores separately, or to mark a signal not applicable, and we currently favour the second without much confidence.
- The plan dependency is unresolved and it is not our variable. If the pooler that answers depends on the billing plan, then two identical generations can differ on the pooling-mode signal for a reason that has nothing to do with either generation. We do not know whether to hold the plan fixed, report it alongside the score, or treat the difference as the finding.
- Query cost is not cleanly separable from the connection question, and we have folded them together on purpose. We are aware that this is the same concession the pagination proposal made in the other direction, and that two adjacent axes both declining to separate the same thing is a sign the boundary is in the wrong place. We would rather say so than draw a line we cannot defend.
- Observability may be unmeasurable from outside. The platform reports we know about are, in Supabase's own words, "not real-time", and a first-party mechanism inside the application is exactly the kind of thing a reference brief would never ask for. Scoring its absence may be scoring the brief.
- We have read library and platform documentation for this proposal and no generated project. That is a deliberate scope choice for an axis proposal and it is also the largest gap in this page. Nothing here is evidence about any builder's output.
Comments, counter-rubrics and reproduction attempts are welcome, and the most useful thing you can send us is the number of simultaneous clients at which your own generated project first returned an error, with the error text and the runtime it was deployed to. That is the correction that changes a rubric before it ever produces a score.
References
- PostgreSQL 18 documentation, "Connections and Authentication",
max_connectionswith its default of "typically 100 connections", the statement that "at most max_connections connections can ever be active simultaneously" and that the parameter "can only be set at server start", andsuperuser_reserved_connectionswith its default of three, https://www.postgresql.org/docs/current/runtime-config-connection.html (accessed September 12, 2026) - PostgreSQL 18 documentation, "Client Connection Defaults",
statement_timeout,transaction_timeout,idle_in_transaction_session_timeoutandlock_timeout, each documented with "A value of zero (the default) disables the timeout", and the note onidle_session_timeoutwarning against enforcing it "on connections made through connection-pooling software or other middleware", https://www.postgresql.org/docs/current/runtime-config-client.html (accessed September 12, 2026) - PgBouncer documentation, "Features", the three pooling modes, the statement that session pooling "supports all PostgreSQL features" and that transaction pooling "breaks client expectations of the server by design and can be used only if the application cooperates by not using non-working features", and the feature compatibility table recording SET and RESET, LISTEN, PREPARE and DEALLOCATE, with-hold cursors and session-level advisory locks as "Never" under transaction pooling, https://www.pgbouncer.org/features.html (accessed September 12, 2026)
- PgBouncer documentation, "Configuration",
max_prepared_statementswith its default of 200, the description of protocol-level prepared statement tracking and internal statement renaming, the note that SQL-level PREPARE, EXECUTE and DEALLOCATE "are forwarded straight to Postgres", and the statement that setting it to zero disables prepared statement support for transaction and statement pooling, https://www.pgbouncer.org/config.html (accessed September 12, 2026) - Supabase documentation, "Connection pooling and limits", the description of a Postgres connection as "a long-lived session" that may hold a connection "for seconds or longer" after "a single 10 ms query", the shared and dedicated pooler split with the dedicated pooler "available on paid plans", the published inequality relating direct and pooled connections to the instance maximum, the note that Supabase services "hold their own connections", the statement that a pooler at its client limit "stops accepting new client connections until existing ones close", and the observation that the dashboard reports "are not real-time", https://supabase.com/docs/guides/database/connecting-to-postgres/pooling-and-limits (accessed September 12, 2026)
- Supabase documentation, "Connect to your database", the port routing for direct connections, session mode and transaction mode, the caution that "transaction mode does not support prepared statements", the per-driver table of flags for disabling them, the transaction-mode limitations list covering set and reset, session-level advisory locks, listen and notify, cursors and temporary tables, and the serverless pool-sizing guidance including "a few dozen instances is enough to exhaust the pool", https://supabase.com/docs/guides/database/connecting-to-postgres (accessed September 12, 2026)
- Supabase documentation, "Supavisor FAQ", transaction mode versus session mode, the "figurative waiting room" description, the note that session mode "can queue clients for up to a minute", the per-combination pool allocation behaviour, and the rule of thumb of keeping pooler usage under 40 percent of available connections where other services share the database, https://supabase.com/docs/guides/troubleshooting/supavisor-faq-YyP5tI (accessed September 12, 2026)
- Prisma ORM documentation, "Connection pool", the statement that from v7 "connection pooling defaults (and configuration) now come from the driver itself", and the pg driver adapter default table recording the v6 pool size formula
num_cpus::get_physical() * 2 + 1against a v7 default of 10, and the acquire and connection timeouts moving from 10 seconds and 5 seconds in v6 to "0 (no timeout)" in v7, https://www.prisma.io/docs/orm/prisma-client/setup-and-configuration/databases-connections/connection-pool (accessed September 12, 2026)
Written by
BuilderProof editorial teamCite this benchmark
BuilderProof editorial team. "Can Ten People Use It at Once? A Proposed Axis for Database Connection and Query Cost (September 2026)". BuilderProof, September 2026. https://www.builderproof.org/benchmarks/can-ten-people-use-it-at-once-database-connection-axis-september-2026.
@misc{builderproof-can-ten-people-use-it-at-once-database-connection-axis-september-2026,
  title  = {{Can Ten People Use It at Once? A Proposed Axis for Database Connection and Query Cost (September 2026)}},
  author = {{BuilderProof editorial team}},
  year   = {2026},
  month  = {sep},
  howpublished = {\url{https://www.builderproof.org/benchmarks/can-ten-people-use-it-at-once-database-connection-axis-september-2026}},
  note   = {BuilderProof, builderproof.org}
}
Frequently asked questions
What does the database connection and query cost axis measure?
It is a proposed BuilderProof benchmark axis, drafted September 12, 2026, that scores whether a generated application still serves requests when several people use it simultaneously, and whether the resources it holds while doing so are bounded by something somebody chose. It is a capacity question about a shared fixed resource rather than a correctness question about a result set, and the failure it targets is a refusal rather than a wrong answer. Seven signals, weighted, scored from the emitted project plus a concurrency probe against a deployed build. No builder is scored on it today.
Why can this not be observed while the application is being built?
Because the property is contention and there is nothing to contend with. During development there is one client, it is the developer, and it is the only thing in the queue. In that condition a pool of one and a pool of a thousand behave identically, a statement with no time limit and one with a two second limit behave identically, and an application that will refuse its eleventh simultaneous user is indistinguishable in every trace anyone collects from one that will serve its thousandth. We call that the empty-waiting-room illusion, borrowing the room from Supabase's own description of a pooled client being sent back to the figurative waiting room after each query.
Is an unbounded query really the default?
At three independent layers, yes, and that is the finding this proposal rests on. PostgreSQL documents statement_timeout, transaction_timeout, idle_in_transaction_session_timeout and lock_timeout each with the sentence that a value of zero, the default, disables the timeout. Prisma's published table for its pg driver adapter shows the acquire timeout and the connection timeout moving from ten seconds and five seconds in v6 to zero, no timeout, in v7. And max_connections is fixed at roughly a hundred, can only be set at server start, and is shared with the platform's own services. The bounded behaviour is the thing you have to ask for.
Does a connection pooler simply fix this?
It fixes the capacity problem and it takes something away, in the vendors' own words. PgBouncer states that transaction pooling breaks client expectations of the server by design and can be used only if the application cooperates by not using non-working features, and its compatibility table records session-level advisory locks, LISTEN, SET and RESET, with-hold cursors and temporary tables as Never under that mode. Two of those are remedies our own axes reward: a session-level advisory lock is one of the three mechanisms our background-work proposal names for overlap control, and LISTEN underpins our realtime proposal. The resolution is scope rather than choice, putting the state inside the transaction that needs it or using session mode for the component that genuinely needs a session.
Does transaction pooling support prepared statements or not?
It depends which pooler answered, and on at least one platform that depends on the billing plan rather than on the code. Supabase cautions that transaction mode does not support prepared statements and lists the flag each driver needs to turn them off. PgBouncer's own compatibility table says protocol-level prepared plans do work in transaction pooling, gated on max_prepared_statements, whose documented default is 200 rather than zero. Both are accurate about their own product, because port 6543 reaches Supavisor for the shared pooler and PgBouncer for the dedicated one. SQL-level PREPARE and DEALLOCATE remain unsupported in transaction pooling either way.
Is this the same as the pagination and large-collection read axis?
No, and that is the closest boundary in the set. That axis has one reader traversing one collection and asks whether every row comes back exactly once, with a cost signal about the price of a deep page. This one has many readers and asks whether a request is served at all. They move in opposite directions: a keyset-paginated list with a bounded page cost can still refuse the eleventh simultaneous reader, and an offset-paginated list that silently skips rows can be perfectly cheap and perfectly available. That proposal's own limitations section concedes that deep-page cost is not cleanly separable from general performance, and the general case it declines to separate is what this axis measures.
Related benchmarks
Pagination and Large-Collection Read Correctness: A Proposed Axis for Whether a Generated List Returns Every Row Exactly Once (September 2026)
A candidate BuilderProof benchmark axis that scores whether the read path an AI app builder emits returns each record of a collection exactly once while the collection is being traversed, and whether read cost stays bounded as the table grows. Seven weighted signals, four structural postures, a traversal protocol, and the point on which three independent pagination specifications agree and generated clients routinely violate.
Does the scheduled job actually run? A background-work correctness axis for AI app builders
A candidate BuilderProof benchmark axis scoring whether the scheduled and deferred work a generated app emits actually executes, executes once, and leaves evidence when it does not. Seven weighted signals, four postures, a ten-step protocol, drafted September 2026 and open for comment.
Can You Actually Self-Host What an AI App Builder Gives You? (September 2026)
Exporting the code is the easy half. We answer the practical question, using BuilderProof scores already published rather than new ones, and name the reason the obvious test gives a false pass.